Wage and the Premier League scaled table
Recently, the www.sportingintelligence.com website produced a Premier League table drawn to a scale where every point was given the same vertical scale. This type of graph is know as a Cann Table and a website dedicated to them can be found here. The website www.experimental361.com also produced some very attractive charts showing the tables in this visual format.
The spending constraints recently voted in by Premier League clubs are essentially designed prevent club debts by tackling escalating wage costs. Against this background it is interesting to combine the Cann Table with a scaled table of wage costs. The result is the attached chart:
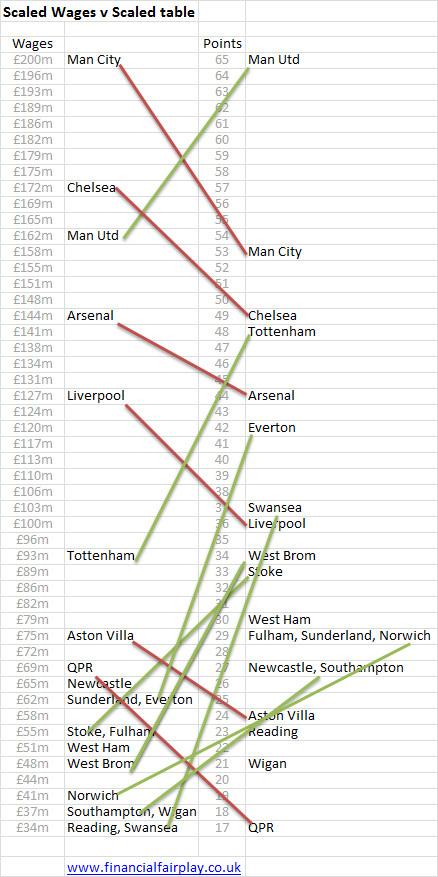
The right two columns represent the current league table drawn to scale. The wage costs (shown in the two left columns) are based on either, recently published wage costs for the 2011/12 season, or, where not available, an estimate of the wage bill.
The wage costs are highly polarised with Man City spending £200m on wages, whereas clubs like Swansea spend only around £35m. Manchester City's (and Chelsea's) spending generates a stretched table with only a few high wage-paying clubs at the top, but most of the clubs paying broadly similar wages around the lower part of the table.
The green and red lines show the clubs that have significantly over-performed (green line) or under-performed (red line) against their wages expenditure. Looking at the clubs who have most over-performed, we see:
- Man Utd, Tottenham, Swansea, Everton, West Brom, Stoke, Norwich and Southampton
The stretching of the wages table has the effect of somewhat over-emphasising the achievements of the lower teams in the league table - however by any standards, these teams have all had a rather good season.
There are six teams that the table suggests have under-performed given the resources at their disposal:
- Man City, Chelsea, Arsenal, Liverpool, Villa and QPR
Interestingly, these are the teams where the managers have probably been under most pressure this season.
It is not a perfect model by any means but does articulate the concept that performance expectation is driven by the amount of money a club spends on wages - when a club's league performance falls below this level, the sack-race odds shorten. When the team over-performs compared to their wage-bill, they are often the ones where the managers receive the media plaudits (e.g. Moyes, Laudrup, Villas-Boas and even Ferguson).
We can expect City and Chelsea's spending to be reigned-in as FFP and the PL spending constraints bite. We should start to see the wages element of the chart become less stretched. One of the risks of the new rules is that Manchester United might take over Manchester City's role as the high spenders in the division. A high wage budget in the hands of a manager who can consistently get the maximum performance from the expenditure, could result in a Premier League procession.
But as the chart shows, there is a distinct difference between having a high wage bill and having a manager who knows what to do with the funds.
blog comments powered by Disqus
