Wage Spend versus points achieved
Article and table updated 3 Jan 2014
After West Ham lost to Manchester United just before Christmas, their manager Sam Allardyce remarked that “where you actually finish in the league depends on the money you’ve spent. It’s a statistical fact that”. This raised an interesting point; clubs will spend money to gain a competitive advantage, but, how by much does a high spend influence results? And what kind of spending? It also raises the question of to what extend a team's performance against wage spend contributes to the level of expectation and pressure put on the manager.
Unlike net transfer-fee spending, wages seem to provide a better measure for determining the performance of club. The web site www.sportingintelligence.com provided the break-down of the spending by each club - the net-spend table is particularly interesting (if only because it shows how difficult it is to identify a link between transfer-fee spending and performance).
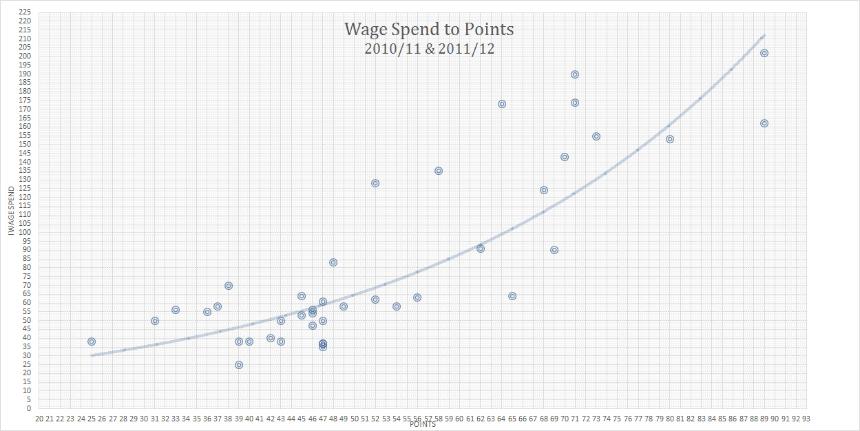
The chart below plots actual wage spend for Premier League clubs against the number of points that each team achieved. There is an obvious relationship - the more you spend on wages, the more points you can expect to accumulate. Interestingly, the curve is exponential - at the bottom end and extra few million makes a big difference but the net benefit decreases with greater spend.
Using the best-fit line we can produce a model of how each Premier League club should perform based on their wage spend. As clubs don't publish up-to-the minute wage spend, we need to make a number of assumptions and projections from the last published wage spend, based on known events and published information. The attached figures therefore carry a number of health-warning and caveats - however I wouldn't expect them to be too far out:
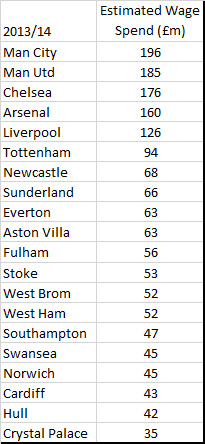
Using the above figures and the model, we get the following table. The left side of the table below shows how many points the club should have after 20 games; the right side of the table shows the actual league after 20 games. The most significant over-performing clubs have been marked.
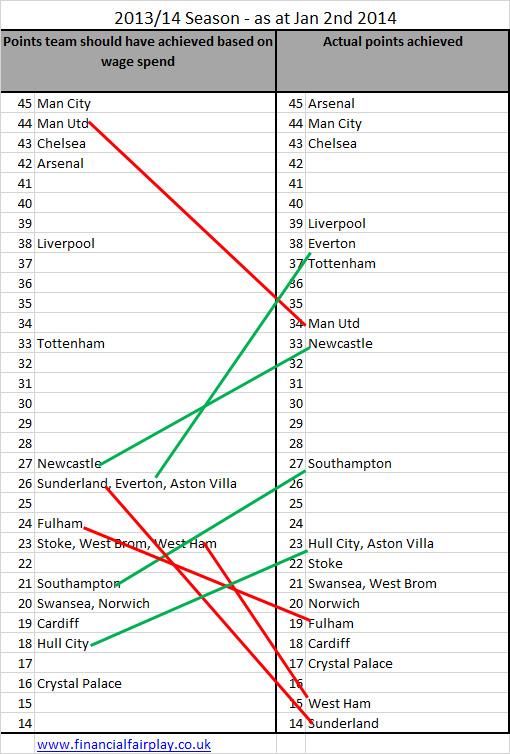
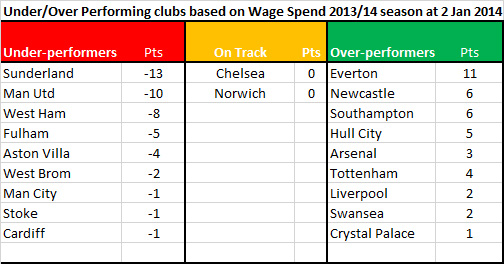
It is interesting to see that the over-performing teams are those where the managers have received media acclaim and the under-performers are relate to teams where a manager has been dismissed or is under pressure. Interestingly, West Ham are one of the biggest under-performers in relation to wage spend - the model suggests they should have gained 8 more points after 20 games. The model suggests Stoke, Cardiff, Chelsea, Norwich, Crystal Palace and Man City are about where we would expect them to be. Sunderland appear to be the biggest under-performers; their last published wage bill was £64m in 2011/12 - events since then suggest the club haven't since reduced their wages appreciably.
blog comments powered by Disqus
