Wages vs Points: scaled tables
Wages vs Points: scaled tables
In February I published a scaled version of the Premier League table which also showed wages paid on the same scale as points earned. The table gave an interesting perspective on which clubs were over and under-performing. I have now updated the table to show the end-of-season position*.
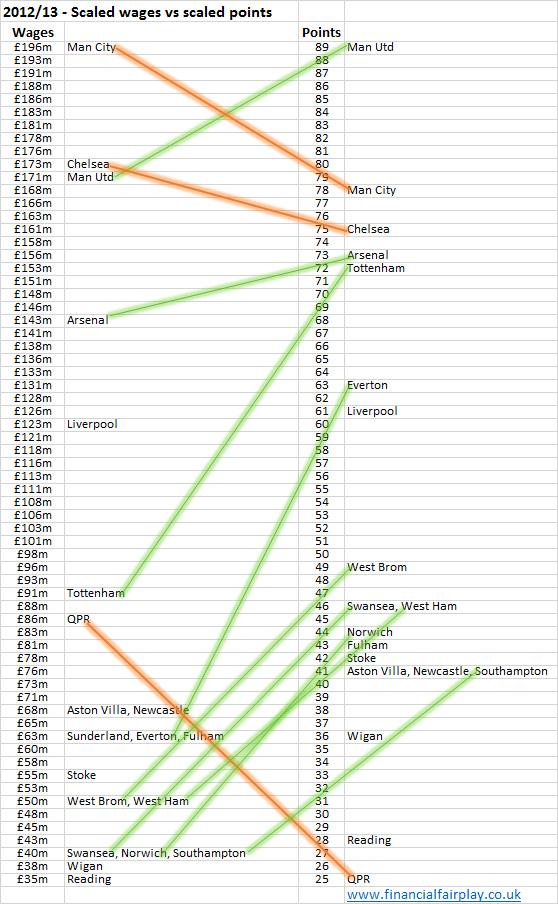
The red and green lines have beedn drawn to highlight the performances that seem to be the most interesting. Whereas the February table gave a good indication of performance, the final table is less satisfying. The table appears stretched at the top end and club are bunched together at the bottom end of the table. This occurs for two main reasons; although most clubs paid wages of around the £40-70m, a few clubs paid significantly higher wages of £170m+. Similarly, the league table is also distorted (largely as a result of Man United's over-performance together with QPR poor showing). Interestingly, the table does clearly illustrate how generally uncompetitive the league was last season, with just 7 clubs in the top half of the scaled table (and the rest well behind).
I have also attached similarly scaled tables for the two previous seasons.
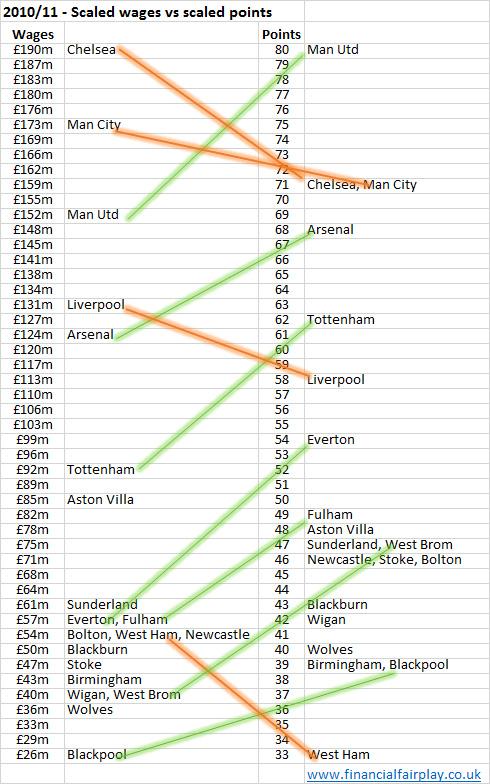

Over the three seasons, Manchester United (Ferguson) ,Tottenham (Redknapp/Villas Boas) and Everton's (David Moyes) performance stands out - in this model, they are the only teams to out-perform their wage spend in each of the last three seasons. It is also interesting to see that although consistently the best team in the Premier League long-term, in recent years, Manchester United have been only the third highest wage-paying team. Interestingly, the only managers to survive an under-performance (a red line) is Mancini in 2010/11 (when City won the FA Cup). Tellingly, Mancini did not survive a second 'red line performance' during the 2012/13 season. Dalglish became manager at Liverpool midway through the in 2011/12 season and was sacked at the end of the club's 2011/12 under-performance. Based on the chart, Rodger's performance last season was fairly flat (although there are indications that things may be changing with a stronger second-half showing reversing a negative performance in the first half of the season).
From next season new financial constraint rules will be in place in the Premier League. The rules restrict a club's ability to increase their annual wage bill wage. Any club paying over £52m in wages cannot increase their wage bill by more than £4m a season. However the rules allow clubs to increase wage spend if they write new commercial deasl (in which case they can increase their wages by the amount of the uplift). These rules will prevent a repeat of the QPR 'project' but will reinforce the status quo - for example Hull City would face a probably points deduction if they decided to match Liverpool's wages next season.
*The 2010/11 and 2011/12 charts are based on the figures reported in the club accounts. We will not know the actual wages for the 2012/13 season for another 9 months so the figures are therefore based on the previous season's figures, adjusted for known events (eg QPR's increased 2012/13 spending). The actual figures are unlikely to be too far adrift from the 2012/13 chart.
blog comments powered by Disqus
